SEA TEMPS TUTORIAL
Sea Surface Temperature is an important component of offshore fishing conditions. Our site provides you with unlimited access to this dynamic data (usually 6 to 8 images per day), geo-references it, and brings it in as your chart background. Since it's your chart background, you can see it's relationship to waypoints of interest, and you have the ability to pinpoint the location of notable tempbreaks, etc. with our Nav Tool (oval with white box, which reads from the center of the oval).
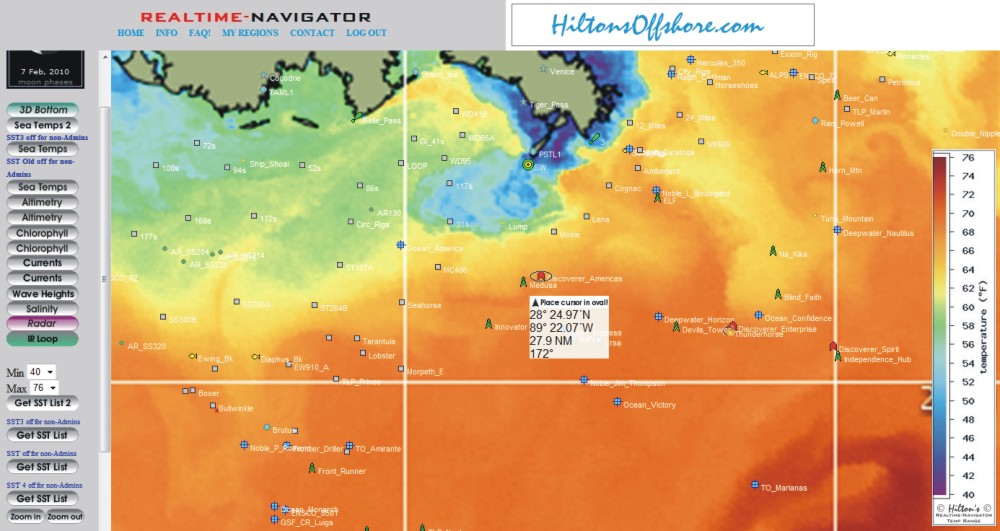
When you click the Sea Temps Button located on the left Nav Bar, it will pull up the absolute latest sea temp image available and ge-references it as your chart background - sample shown is an image off of the Mississippi Delta based on a 40-76 degree temp range. This range captures the very cold, fresh water coming out of the mouth of the Missippip and the very warm water found in a counter eddy peeling off of the Loop Current. The problem with this image is that there is too broad of a temp range for this to be very useable in the areas that you want to go fish - the broader your range, the more diffuse your data becomes.
We give you the tools to "tweak" the image based on your specs, to "focus" on the area of YOUR interest, which in this case is the Drillship "Discoverer Americas" - I have the nav tool positioned on the drillship "Discoverer Americas" which is currently stationed off of Medusa, which shows that this ship is 29.7 nautical miles at 172 degress from the SW Pass buoy.

If you look at the left nav bar, under the buttons, you will see 2 little indows "Min" and "Max". The default numbers in these windows are 67 and 82, and you can ignore those values, as they are just 2 random numbers. I have adjusted this image, using the Min?max windows, to show the colors relative to a 40-76 degree range. Look at the image and correlate the warm/cool colors on the image to warm/cool temperatures on the temp scale which is always on the right of your screen. The temperatures in the area around Discoverer Americas looks to be in the 62 to 72 degree range, so insert 62 into the "Min" window, 72 into the "Max" window, then click "Get SST List2". This tells the program that you are only interested in the data on the screen that is within this range, and "repaints" all of the images from the last couple of weeks on this new range. NOTE: Be sure to make a note of the date/time stamp on the upper left corner of the sea temp image, which, in this case is 2010/1/27 08:18 UTC (January 27th, 2010, 08:18 Greenwich time, which is about 6 hours ahead of Eastern Standard time).
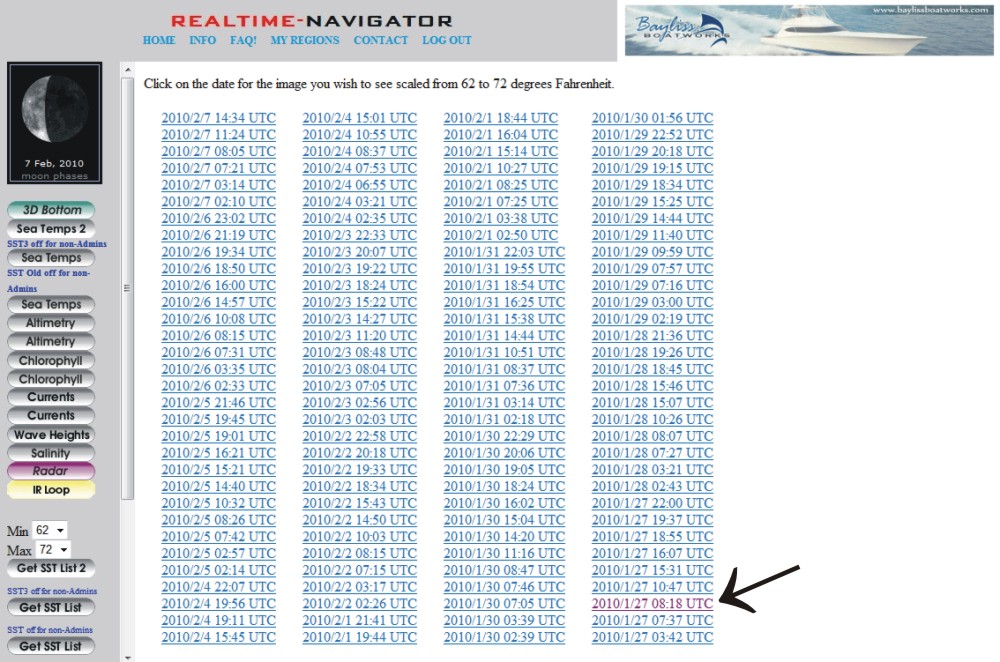
Once you click the "Get SST List2" button, you will be taken to the "SST List2", as shown. NOW you see why it's important to remember your date/time stamp!
.

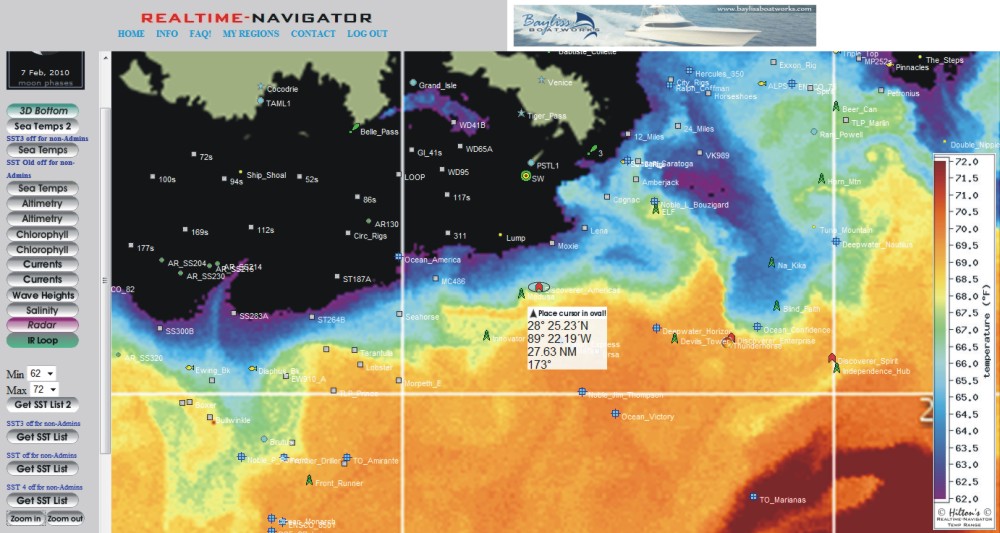
Click on the 2010/1/27 08:18 UTC and the "repainted" image will pull up as shown below;

This is the same image as originally shown, but it looks dramatically different; any data cooler than 62 degrees gets wiped off as black, any data warmer than 72 degrees gets wiped off as a dark maroon. You will notice that the Discoverer Americas is actually positioned on a nice 2 degree temp break (about 66 degrees on the cool side, 68 degrees on the warm side).
This level of differentiation was not possible with the original image, and gives you USEABLE data with which to plan your trip - this is what differentiates Hilton's from other sea temp services.
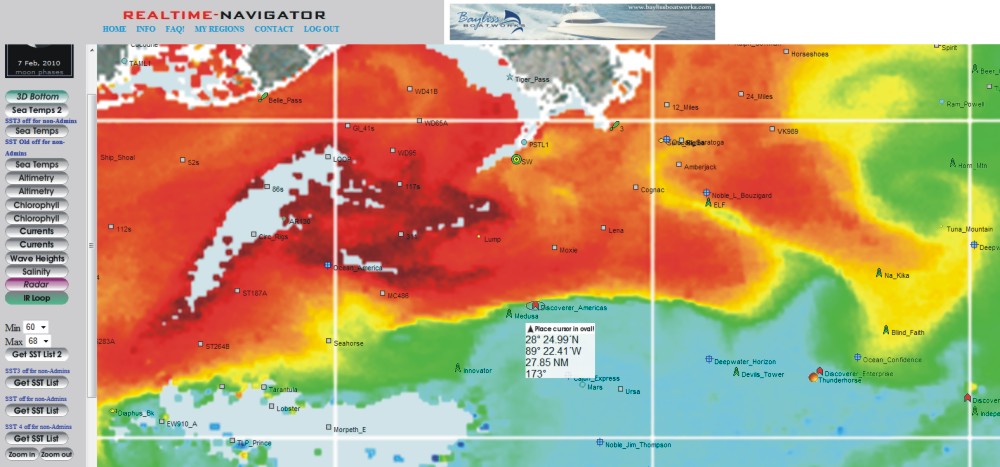
I am including a the chlorophyll image here as well to illustrate the correlation of temp breaks and water color changes - you will notice that there is a very distinct water color change that dovetails with the temp break. The significance? Now, we have structure (Discoverer Americas) situated on a nice temp break AND water color change (3 favorable things combining in one spot). Look elsewhere on the image and you will see a strong correlation to the temp breaks and water color conditions.

CLICK HERE FOR MORE INFO ON CHLOROPHYLL
This information Copyrighted 2010 Hilton's Fishing Charts - All Rights Reserved.