TUTORIAL
ALTIMETRY TUTORIAL
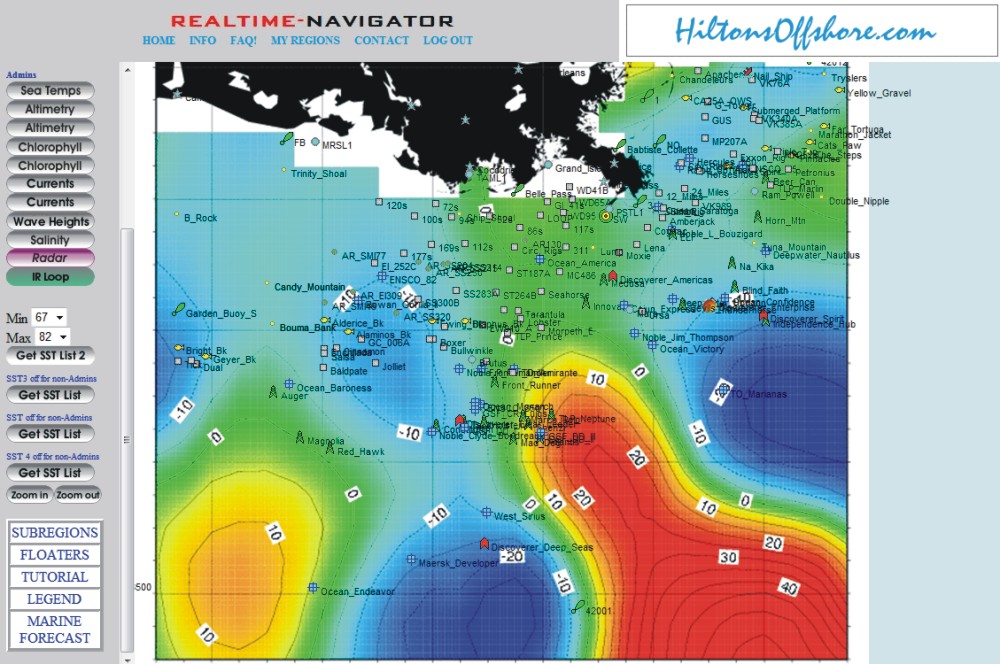
Altimetry is an imagery that shows the upwelling currents (nutrient-rich) and the downwelling currents (nutrient-poor) areas are situated, and is generally the first imagery to consider as it will tell you not only where you want to go, but as importantly, where NOT to go.
The imagery is generated by a radar instrument that measures a VERY subtle change in the ocean's surface level, thus creating a contour map of the ocean's surface. The contour map is displayed in 5CM increments (about 2") and are numbered every 10CM. The cool colors (green, light blue, dark blue) indicate the upwelling, nutrient-rich cyclones, while the warm colors (yellow, orange, and red) indicate the downwelling, nutrient-poor areas. Dark blue = best, light blue is good, green = OK, yellow/orange = not so good, and red = Heck No!
You want to now start looking at what structures and what the other imageries are showing inside the favorable, upwelling areas while avoiding those in the downwelling nutrient-poor areas.

The next imagery I usually look at is the Sea Temps imagery....
This information Copyrighted 2010 Hilton's Fishing Charts - All Rights Reserved.